

River Water Quality and Landscape in the Kumena and Tatau Basins, Sarawak, Malaysia [Keitaro Fukushima]
River Water Quality and Landscape in the Kumena and Tatau Basins, Sarawak, Malaysia
Keitaro Fukushima (Field Science Education and Research Center, Kyoto University) River water quality is a very useful indicator of upstream terrestrial environment including land use, geology, lifestyle, development of infrastructure, and so forth. For example, the concentrations of calcium (Ca2+), magnesium (Mg2+) ions and dissolved silica (Si) are mainly controlled by underlying bedrock geology; nitrogen (N) and phosphorus (P) concentratios reflect land use such as agriculture and urbanization; and chloride ion (Cl–) concentration is likely proportional to the distance from the sea. Mines, factories, and livestock facilities can discharge high concentrations of N, P, certain metals, and other pollutants into rivers as the point source. Forest clear-cutting and land use changes, such as forest to agricultural or residential areas and natural to plantation forests, alter river water quality including N on a time scale of years to decades. Plant growth in forests, fertilization in agricultural lands and people’s daily lives affect river water quality on a time scale of days to a year. Therefore, in order to comprehend the relationship between land use and river water quality, not only spatial distributions over a basin, but also temporal patterns of water quality at the same point are required. People living in the basin use river water as a source of drinking water and for agricultural and industrial water. Productivity and survival of riverine and marine biology highly depend on water quality, and consequently it makes or breaks a fishery’s success. Because we can speculate about the reason for the changes in river water quality and its influences on human life, it is necessary to conserve and monitor river water quality to secure a foundation for people’s lives, similar to conducting urine and blood tests to evaluate our health. That’s why water quality surveys are compared to medical checkups. In Sarawak, Malaysia, tropical natural forests and rubber and timber cultivation areas have been converted into magnificent acacia and oil palm plantations over the past few decades. In order to elucidate the influences of this landscape shift on river water quality, we will analyze (1) the relationship between each land use and water quality, and (2) the changes in water quality downstream in the Kemena and the Tatau basins. In our research, nitrate nitrogen (NO3–), dissolved organic carbon (DOC) and suspended sediments (SS) in river water are significant substances for meeting our objectives. The characteristics of these substances are introduced below. 1) NO3– In many tropical and temperate forests, plants’ growth (or net primary production) is limited by N, because of small storage and low supply rates of available plant N (i.e., NO3– and ammonium [NH4+] N) in soil. Plant uptake of NO3– largely minimizes its leaching from the forest ecosystem to rivers and balances its input from the atmosphere with its leaching, which is supported by some evidence that a large amount of NO3– discharges when a forest is clear-cut. This phenomenon is temporal and recovers gradually with re-establishment of the forest, but in the case of intensive and destructive disturbances including forest clear-cutting and harvesting with soil tillage, as well as drastic changes in vegetation from natural forests to monocultural plantations, it takes a long time to recover, or to move to another equilibrium state. Nitrate discharge is also affected by N fertilization in agricultural areas and plantations and sewage in residential areas. In most cases in Japan, the concentration of NO3– increases with an increases in farm lands and urban areas from forested headwater downriver. In contrast, in Sarawak, because even headwaters are covered with acacia and oil palm plantations, the spatial distribution of NO3– concentration over the basin may be different from the Japanese case. However, examining the NO3– concentration in order to understand the relationship with land use and identifying the source of NO3– is ineffective. To specify the origins of NO3–, the isotopic compositionsNote1 of nitrogen (δ15N) and oxygen (δ18O) of NO3– (hereafter denoted as δ15N-NO3– and δ18O-NO3–, respectively) are very effective (Figure 1). The sources of NO3– in river water include microbial nitrification in soils (low δ15N-NO3– value), synthetic fertilizers (low δ15N-NO3– value but high concentration), sewage and manure (high δ15N-NO3– value and high concentration), and atmospheric deposition (high δ18O-NO3– value but low concentration). In addition, under the reductive and anaerobic condition, some bacteria in soil and water denitrify the NO3– to N2O and N2 gas. This process enriches both δ15N-NO3– and δ18O-NO3–. The combination of the concentration and the isotopic composition of NO3– enables us to elucidate the factors determining NO3–discharges in this region.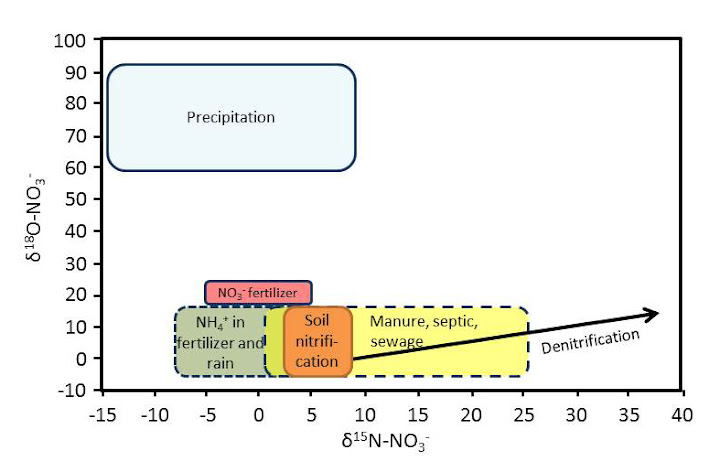
Fig.1(a): Isotopic signatures for different NO3– sources
From Kendall (1998).
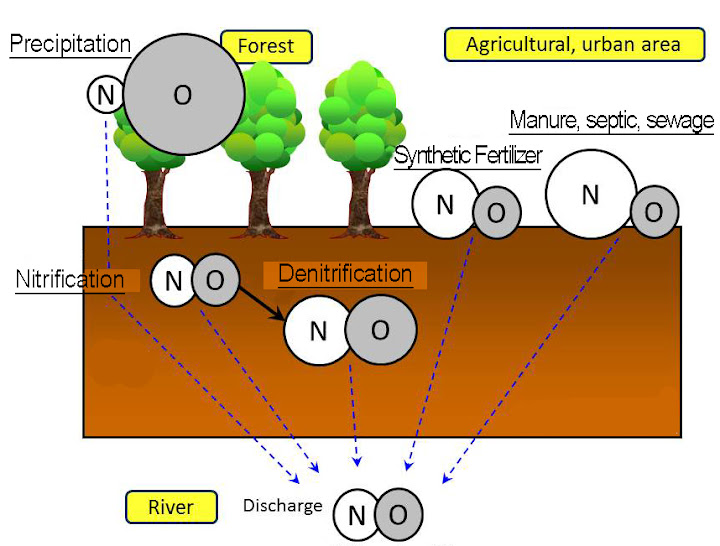
Fig.1(b ): Schematic diagram of the qualitative relationship between δ15 and δ18O of NO3– in different sources based on (a)
We analyze the source of NO3– in river water using δ15 and δ18O of atmospheric and overland NO3–.
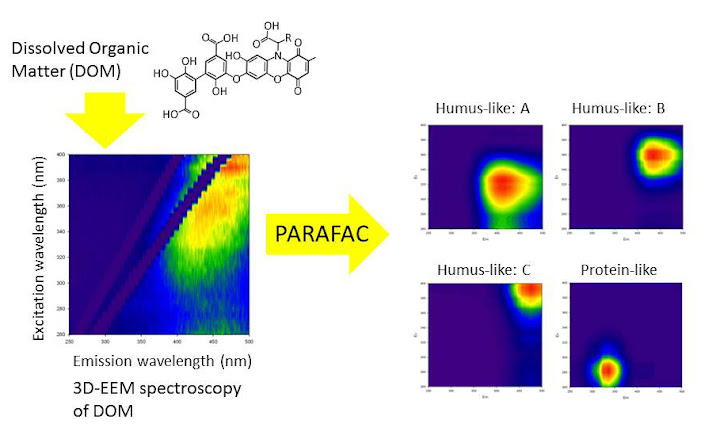
In our research, the spatial distribution of NO3– concentration and δ15N-NO3– and δ18O-NO3– values are investigated, and the relationship with the land use characteristics such as natural forest, secondary forest, acacia plantation, oil palm plantation, peat swamp forest, agricultural land, and urban area, are analyzed. In addition, the relationship between NO3– discharge and tree ages of plantations or land use history are examined to evaluate the impacts of plantation and forest management on river water quality. 2) DOC Organic matter dissolved in water (DOM; dissolved organic matter) plays a key role in terrestrial and aquatic ecosystems, because the flux of DOC and DON (dissolved organic nitrogen) from land to the sea accounts for a considerable proportion of global C and N cycling. In addition, iron (Fe) is easily deposited and biologically inactivated in aquatic ecosystems, but humic substances, which are a part of DOM, can chelate iron (Fe). This stabilized iron-DOM complex functions as an essential nutrient for algae. The main source of DOM seems to be humic substances in soils. River water discharged from peat swamp forests, which contain a large amount of organic matter subterraneously, has a high DOM concentration. Recent reports, however, suggest that the contribution of autochthonous DOM (derived from plankton) is also important for understanding DOM dynamics in aquatic ecosystems. Therefore, in our research, we will examine not only the concentrations of DOC and DON quantitatively, but also the characterization of DOM qualitatively in the Kemena and Tatau basins. One of the best ways to obtain DOM characterization is three-dimensional excitation and emission matrix (EEM) fluorescence spectroscopy (Figure 2). The concentration and fluorescence of DOM are expected to reveal factors controlling DOM concentration and the transformation processes of DOM in the context of landscape changes and forest management.
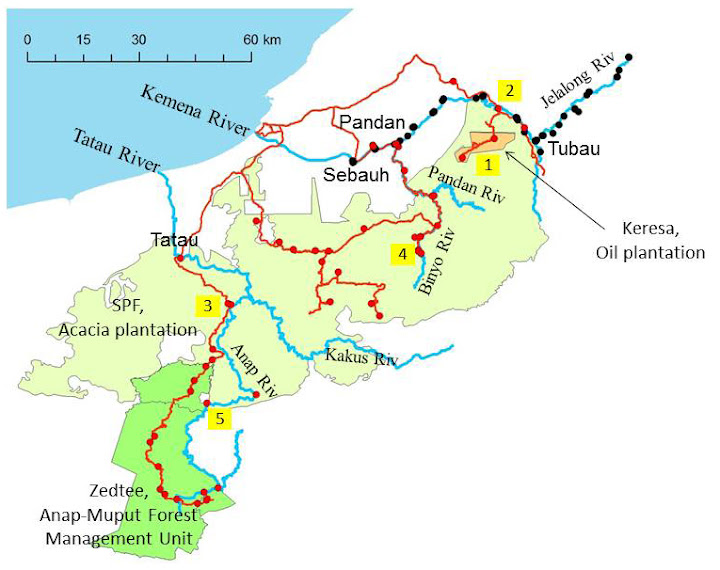
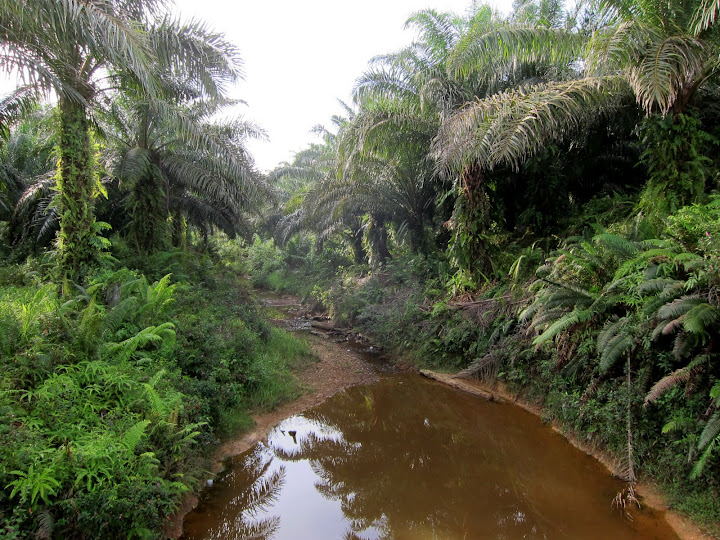
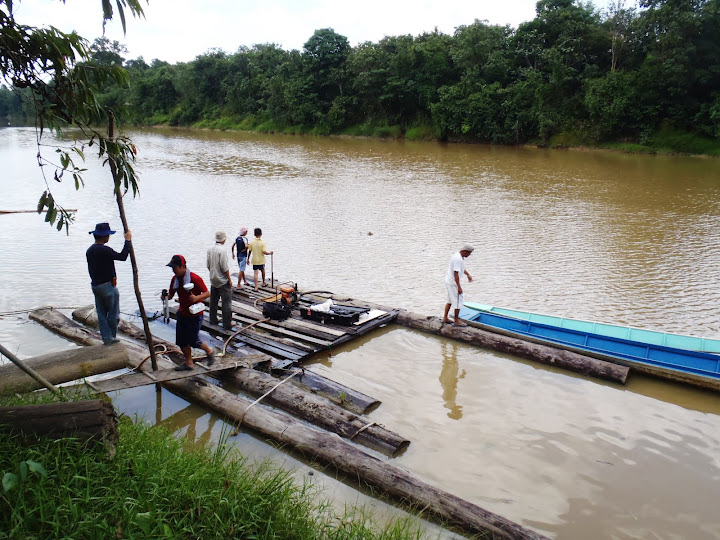
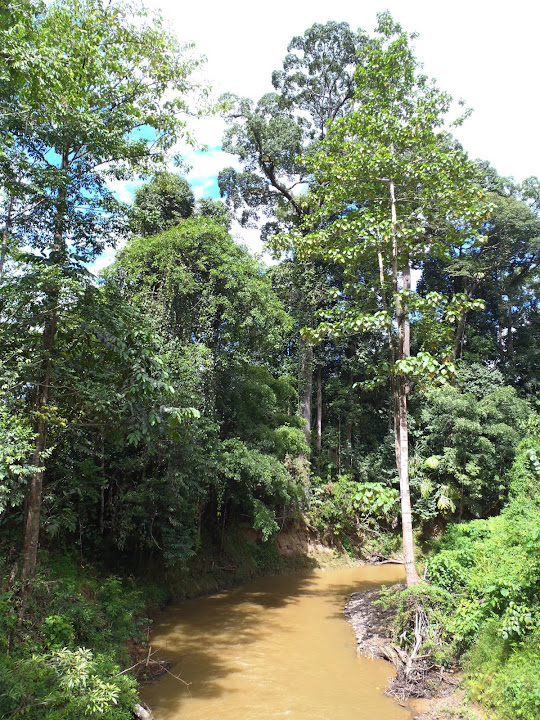
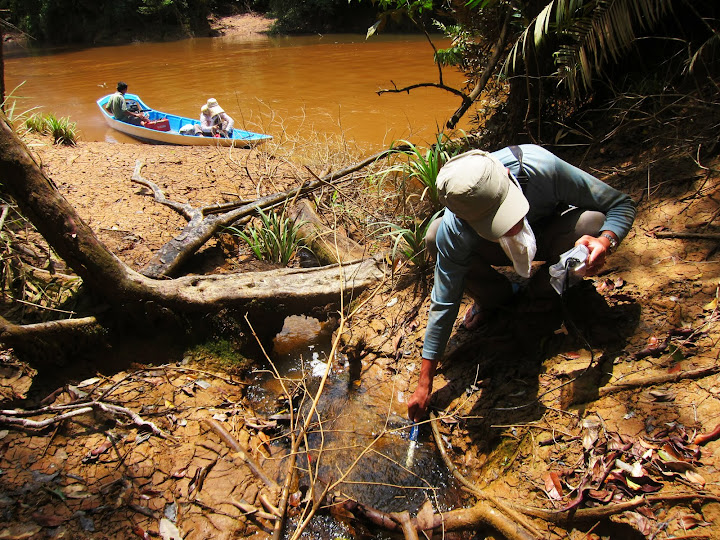
3) SS A large part of water turbidity is SS, which inhibits photosynthesis by phytoplankton. When we measure some ions and DOM, collected river water is filtrated by a filter with a pore size of 0.45 µm. SS is that which remains on the filter and contains coarse particulate organic matter, clay minerals, and so forth. SS in river water consists of various sources: direct input of plants, litter and animal dung, algae, soils derived by bank erosion, disturbances and forest cutting, and chemically aggregated matter in water. In the Kemena and Tatau Rivers, we investigate the spatial distributions of SS concentration as well as the ratio of minerals to organic matter, and the isotopic composition of C (δ13C) and N (δ15N). The results are expected to elucidate the compositions of SS and the sources of river water turbidity in the Kemena and Tatau basins. The Kemena and Tatau basins have various landscapes including natural tropical forests, secondary forests, peat swamp forests, acacia and oil palm plantations, heath forests, agricultural lands, and urban areas, and these landscapes are now converting. Ongoing land use changes result in an alteration in river water quality. If the results of river water quality surveys suggest some problems in a certain landscape or land use change, possible reasons for the water quality should be considered and solutions prescribed. Otherwise as the myth of sustainable development predominates for people living in the basin, river water quality may threaten their health as some Japanese rivers used to do, and it may never recover with further land use changes. It is an urgent task that factors determining river water quality and the changing processes of water quality along with land use changes are elucidated by analyzing the spatial distributions of water quality and the relationship with the landscape. Reports of survey trip in Aug 2011 Our surveys were conducted in August 2010 and 2011. In 2010, I had just joined a meeting in Kuching, so this was my first overseas research trip in 2011. In the Japanese fieldwork, we often collected water samples, filtrated them, and measured pH and Electric Conductivity (EC), but in Malaysia, I was very surprised to see brown water that resembled “Kopi”, or black water drained from swamp forests that resembled “soy sauce”, and it was extremely difficult to filtrate some samples because brown samples had a very high SS content. For sample collection, sometimes I would take a boat ride under the burning sun, sometimes I drove a car through endless acacia plantations with flying clouds of dust, and sometimes I hitched a ride in the back of a Landcruiser at high speed, which was just like being on a roller coaster without the safety belt. All of these journeys were extremely inspiring. Sampling water was a very thrilling experience, and although filtration was very difficult every night, we managed to get our samples. After arrival in Japan, they are analyzed by temperamental analytical instruments. In other words, it takes a lot of time, money and energy to obtain water quality data. In August 2010, water samples from the Jelalong River, which is located upstream of the Kemena River, were collected, and in August 2011, we surveyed more tributaries as well as main streams of the Kemena and Tatau Rivers. We collected many samples including tributary river water draining from the Pandan and Binyo areas covered with peat swamp forests, acacia plantations and conservation natural forests held by Sarawak Planted Forest (SPF) Sdn Bhd, and oil palm plantations held by Keresa Plantations Sdn Bhd, in the Kemena basin. We also collected main river water near Tubau, Pandan, Sebauh and so forth, to understand changes in water quality from upriver to downriver. In the Tatau basin, we collected water samples from the Anap River and its tributaries within forests in the Anap-Muput Forest Management Unit managed by Zedtee Sdn Bhd, and Tatau River water near Sangan. In addition, we requested people living by the river, SPF and Zedtee to collect river water bimonthly to elucidate time series variation of water quality. Aside from some misgivings about handling vast amounts of collected samples, they had to clarify spatio-temporal distributions of water quality in the Kemena and Tatau basins, and have given us a new insight into factors determining water quality. The results from the past several months’ research are introduced in this newsletter.
Acknowledgment
I would like to thank Dr. Hiromitsu Samejima, Dr. Naoko Tokuchi, and Mr. Jason Hon for their help in arranging all surveys, contacting the institutions and persons concerned, and collecting water samples. I also thank Dr. Osamu Kozan, Dr. Yucho Sadamichi, and Mr. Logie Seman for supporting our field survey. Thanks to them, I had a wonderful time. Finally, I am grateful to Dr. Noboru Ishikawa and Dr. Ryoji Soda for their useful advice on my research.
Note1
Isotopes
Atoms of the same element can have different numbers of neutrons (i.e., the different atomic weights). These are called isotopes. Some isotopes are naturally stable, but others are unstable, which undergo radioactive decay (alpha decay, in which an atomic nucleus emits an alpha particle (4He), and thereby transforms into another atom; or beta decay, in which a beta particle (an electron) is emitted from an atom). Here, I introduce stable isotopes.
Stable isotopes have been used in ecological and biological studies (mostly carbon (C), nitrogen (N) and oxygen (O)) for many years. When we want to describe an isotopic composition, we use thea ratio of a target isotope to another isotope with greatermore abundance. For exampleexamples, N has a heavy isotope (15N) with a natural abundance of 0.4 % and a light isotope (14N) that constitutesmakes up all of the remainder. Thus, the N isotope ratio is 15N/14N. In the same way, we use 13C/12C, 18O/16O and so forthon. In isotopic analysis, the absolute abundances of isotopes and the ratio of isotopes are not considered. Rather, we use the stable isotope compositions expressed in terms of delta (δ) values; the ratio of isotopes in the sample compared to the standard ratio using the following equation:
δ15N(δ18O, δ13C)=Rsample-Rstd/Rstd × 1000(0/00)
Where Rsample and Rstd represent the ratio of the isotope of the sample and the standard, respectively. The standard references for N, O and C are N gas in the atmosphere, Vienna standard mean ocean water (VSMOW) and PeeDee Belemnite, respectively. Higher δ values indicate increases in the amount of heavy isotopes and lower values indicate decreases. The δ values enable us to describe the isotopic signature sensitively. The mass difference will result in partial kinetically-caused separation of the light isotopes from the heavy ones during chemical reactions, during biological activities such as metabolization, and during physical processes such as vaporization and diffusion. This process is called “isotope fractionation”. For this reason, isotopes of C, N, and O (δ13C, δ15N, δ18O etc.) are the most effective as hydrological and biogeochemical indicators. For example, transformation of NH4+ to NO3– by soil microbes or photosynthesis of CO2 to glucose in the leaves deplete the light isotope contained in products (NO3–-N and C-glucose in this case). The δ13C and δ15N can also help ecologists to understand the sources of food and food web structure in terrestrial and aquatic ecosystems, because organisms are enriched in 15N and 13C as their trophic level increases.